From Data Sheets to Real World: A Practical Guide to Material Properties
From Data Sheets to Real World: A Practical Guide to Material Properties
Selecting the optimal material for sealing applications is critical for engineers to ensure the longevity, reliability, and effectiveness of seals. While material data sheets provide essential information, translating these properties from theoretical data to practical applications can be challenging. This blog series, “From Data Sheets to Real World: A Practical Guide to Material Properties for Sealing Products,” aims to bridge that gap by offering an in-depth exploration of key material properties and their specific relevance to sealing products.
In this series, each post will focus on a specific set of properties, detailing their measurement, significance, and influence on the selection and performance of seals.
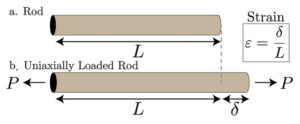
Stress and strain are fundamental concepts in mechanics that describe how materials respond to external forces. These principles are often illustrated using a solid metal bar under uniaxial loading, where equal and opposite forces are applied along the same axis, causing the bar to stretch. This stretching induces internal forces that counteract the applied forces, maintaining equilibrium.
To better understand these internal forces, one can imagine making an imaginary cut through the bar. Whether the right or left side is removed, the remaining section will adjust its internal forces to balance the external forces, ensuring equilibrium is maintained. While these internal forces can be depicted in various ways, it’s more practical to discuss stress, which describes how these forces are distributed within the material. Stress is quantified as the internal force per unit area, expressed in Pascals (Newtons per square meter) in SI units or pounds per square inch in US units.
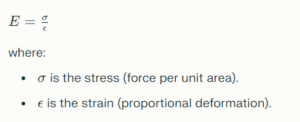
The mathematical formula for stress is:
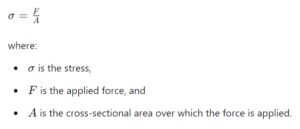
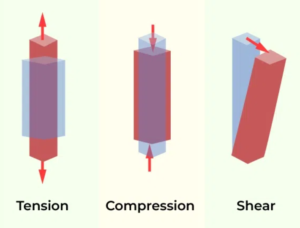
In the case of the axially loaded bar, the internal forces act perpendicular to the cut, resulting in what is known as normal stress. This stress can be calculated by dividing the applied force by the bar’s cross-sectional area, and it is denoted by the Greek letter sigma (σ). Understanding stress is crucial as it helps predict when a material might fail. For instance, a bar made of mild steel, which has a strength of 250 MPa, will fail if the stress exceeds this threshold. For a bar with a 20 mm diameter, failure occurs if the applied force surpasses 79 kN. Normal stress can be tensile, when the forces stretch the bar, or compressive, when the forces compress it. Tensile stresses are typically considered positive, while compressive stresses are negative.
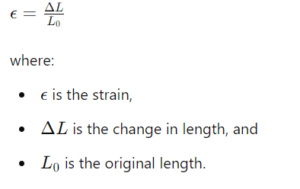
Strain, on the other hand, measures the deformation that occurs within a material. If one end of the bar is fixed and a force is applied to the other end, the bar will deform, and the normal strain can be calculated as the change in length divided by the original length. Strain is a dimensionless quantity often expressed as a percentage and can be tensile or compressive.
The formula for strain is:
In addition to normal stress, there is also shear stress, which occurs when forces are applied parallel to a surface. This is common in scenarios like bolts under shear loading. Shear stress is denoted by the Greek letter tau (τ) and can be calculated similarly to normal stress, as the applied force divided by the cross-sectional area. However, shear stress is typically unevenly distributed across the cross-section. Shear strain, associated with shear stress, is defined as the change in angle and is denoted by the Greek letter gamma (γ). Hooke’s Law also applies to shear stress and strain, with the shear modulus G replacing Young’s modulus. In practice, the stress state at a point within a material will have both normal and shear components, depending on the orientation of the plane being observed.
The stress-strain curve represents the relationship between stress and strain, derived by subjecting a material specimen to an incrementally increasing load and measuring the corresponding deformation. This curve provides vital insights into the material’s mechanical properties, including its elasticity, yield point, tensile strength, and fracture point, which are essential for assessing how materials will behave under various loading conditions.
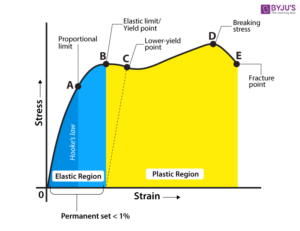
The stress-strain curve is divided into two primary regions: the elastic and plastic regions.
The elastic region is characterized by a linear relationship between stress and strain, as described by Hooke’s Law. In the elastic region, the material deforms proportionally to the applied stress and returns to its original shape upon the removal of the load.
Key Features of the Elastic Region

Importance of the Elastic Region
Understanding the elastic region is crucial for engineers when selecting materials for various applications. Here are some key reasons why the elastic region is important:
The plastic region of the stress-strain curve is critical for understanding how materials behave under permanent deformation. When a material is loaded beyond its elastic limit, it enters the plastic region, where deformation is irreversible, and the material does not return to its original shape once the load is removed.
Key Characteristics of the Plastic Region
Importance of the Plastic Region
There are seven pivotal points that are indispensable for engineers in material selection. Indeed, each point provides profound insights into the material’s response to applied forces, ranging from initial deformation to ultimate failure. The following section will elucidate each key point on the stress-strain curve and discuss their significance in informing engineering decisions.

Description: The proportional limit for rubber and plastic materials is the point on the stress-strain curve where the initial linear relationship between stress and strain ceases. Up to this point, the material exhibits elastic behavior, meaning it will return to its original shape when the load is removed. For rubber, this limit is generally much lower than for metals due to its highly elastic nature, while for plastics, it can vary significantly depending on the type (e.g., thermoplastics versus thermosets).
Significance: In rubber and plastic materials, understanding the proportional limit is essential for applications such as seals, gaskets, and flexible components, where the material must revert to its original shape after deformation. For instance, in dynamic seals that experience repeated cycles of deformation, staying within the proportional limit ensures longevity and functionality. This helps in designing components that avoid permanent deformation under operational loads, thus maintaining sealing performance and reliability.
Description: The elastic limit is the maximum stress that rubber and plastic materials can withstand without experiencing permanent deformation. Beyond this point, the material begins to deform plastically and will not return to its original shape once the load is removed. For rubber, this limit is associated with the maximum extent of its elastic deformation, while for plastics, it marks the onset of yielding and the transition to plastic behavior.
Significance: The elastic limit is crucial for ensuring that rubber seals and plastic components do not undergo permanent deformation under expected load conditions. For example, in applications like automotive seals or pressure-sensitive gaskets, exceeding the elastic limit could result in leaks or failure of the seal. Engineers must design components that operate within the elastic limit to ensure reliability and maintain performance over the product’s life.
Description: The yield point in rubber and plastic materials marks the transition from elastic to plastic deformation. In rubber, yielding is less distinct and more gradual, while in plastics, especially semi-crystalline types, it can be more pronounced with a clear yield point. This is the point where the material starts to flow and deform permanently under constant stress.
Significance: The yield strength is critical in the design of rubber and plastic components that must not undergo permanent deformation under normal operating conditions. For example, in high-stress applications such as industrial seals or structural plastic components, knowing the yield point helps engineers ensure that the material can withstand operational stresses without permanent deformation, which could compromise the component’s integrity and function.
Description: In rubber, strain hardening occurs as the polymer chains become aligned and entangled, leading to an increase in stress with continued deformation. In plastics, strain hardening is characterized by an increase in strength and hardness as the material is deformed, due to the reorientation and densification of polymer chains.
Significance: Strain hardening is important for applications where the material needs to become stronger under load, such as in reinforced rubber products or high-performance plastic components. Understanding this behavior allows for the design of materials that can endure higher stresses after initial yielding, improving durability and performance. For instance, strain-hardened rubber may be used in high-stress dynamic sealing applications, while strain-hardened plastics could be used in load-bearing structural parts.
Description: The ultimate tensile strength (UTS) represents the maximum stress that rubber or plastic materials can withstand while being stretched before necking occurs. For rubber, the UTS is achieved when the material undergoes significant strain and molecular alignment, ultimately leading to failure. In plastics, the UTS marks the highest stress point before substantial plastic deformation and eventual fracture. This peak stress value, known as tensile strength, is commonly listed on material data sheets, providing a key indicator of the material’s performance under tensile loads.
Significance: UTS is a measure of the maximum load a material can bear, which is crucial for applications subjected to high tensile forces. In rubber products, such as tensile seals or belts, and in plastic components used in high-stress environments, understanding UTS ensures that the material can handle the maximum expected load without failing. This is vital for ensuring safety and performance in applications ranging from industrial machinery to consumer products.
Description: The necking region is where the cross-sectional area of the rubber or plastic material begins to decrease significantly under tensile stress. This leads to localized stress concentration and further deformation, ultimately resulting in fracture. In rubber, necking is less pronounced due to its high elongation properties, while in plastics, especially brittle types, necking can be more evident and lead quickly to failure.
Significance: Understanding the necking behavior in rubber and plastic materials helps engineers predict the point at which a material will start to fail under tensile stress. This knowledge is crucial for designing components that can withstand high-stress conditions without catastrophic failure. For example, in safety-critical applications like pressure vessels or structural components, accounting for necking behavior ensures that materials are used within their safe limits.
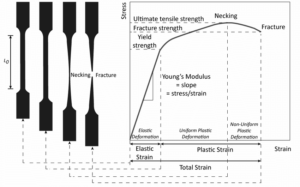
Description: The fracture point is where rubber or plastic materials ultimately fail and break apart. This point signifies the end of the stress-strain curve and is characterized by the material’s inability to withstand any additional stress. Known as ultimate elongation, this point is commonly listed on material data sheets, providing a critical indicator of a material’s breaking threshold.
Significance: The strain at the fracture point is used to determine the material’s ductility and ultimate elongation. This information is essential for applications requiring materials to absorb significant energy before breaking, such as in impact-resistant components and safety devices. For instance, in automotive bumpers or protective gear, materials with high ductility and energy absorption can prevent catastrophic failure and protect the underlying structure or user.
In this post, we have examined the critical relationship between stress and strain, laying the groundwork for understanding key tensile properties such as tensile strength, modulus of elasticity, and elongation. In the next installment of this series, we will delve further into tensile properties and how engineers can interpret this data to make more informed material selection decisions.
If you’re looking to deepen your understanding of stress and strain, this YouTube video is an excellent resource. It provides a clear and engaging visual representation of these fundamental concepts, using the example of a metal bar under uniaxial loading.
Engineering LibreTexts, 2023. Stress-Strain Curves. Available at: https://eng.libretexts.org/Bookshelves/Mechanical_Engineering/Mechanics_of_Materials/01%3A_Introduction/1.04%3A_Stress-Strain_Curves [Accessed 7 August 2024].
Materials Science & Engineering Student, 2023. Stress, Strain, and the Stress-Strain Curve. Available at: https://msestudent.com/stress-strain-and-the-stress-strain-curve/ [Accessed 7 August 2024].
Wikipedia, 2024. Stress–strain curve. Available at: https://en.wikipedia.org/wiki/Stress%E2%80%93strain_curve [Accessed 7 August 2024].
Mechtics, 2023. Stress strain curve for mild steel. Available at: https://mechtics.com/stress-strain-curve-for-mild-steel/ [Accessed 7 August 2024].
Nuclear Power, 2024. Ultimate Tensile Strength – UTS. Available at: https://www.nuclear-power.com/materials/ultimate-tensile-strength-uts/ [Accessed 7 August 2024].
Physics LibreTexts, 2023. 12.4: Stress, Strain, and Elastic Modulus (Part 1). Available at: https://phys.libretexts.org/Bookshelves/General_Physics/Book%3A_College_Physics_(OpenStax)/12%3A_Solids_and_Fluids/12.4%3A_Stress%2C_Strain%2C_and_Elastic_Modulus_(Part_1) [Accessed 7 August 2024].
Engineering ToolBox, 2024. Stress, Strain and Young’s Modulus. Available at: https://www.engineeringtoolbox.com/young-modulus-d_417.html [Accessed 7 August 2024].
Embibe, 2024. Stress-Strain Curve: Definition, Formula, Examples. Available at: https://www.embibe.com/exams/stress-strain-curve-definition-formula-examples/ [Accessed 7 August 2024].
Pressbooks Online, 2024. 12.3 Stress, Strain, and Elastic Modulus – General Physics Using Calculus I. Available at: https://pressbooks.online.ucf.edu/osuniversityphysics/chapter/stress-strain-and-elastic-modulus/ [Accessed 7 August 2024].
Cumberland Rubber Supply, 2024. The Relationship Between Tensile Strength, Elongation, & Modulus. Available at: https://cumberlandrubber.com/the-relationship-between-tensile-strength-elongation-modulus [Accessed 7 August 2024].
Techno Ad, 2024. Tensile Strength, Elongation, and Modulus in Rubber Materials. Available at: https://www.technoad.com/tensile-strength-elongation-modulus-in-rubber-materials [Accessed 7 August 2024].
MechaniCalc, 2024. Mechanical Properties of Materials. Available at: https://mechanicalc.com/reference/mechanical-properties-of-materials [Accessed 7 August 2024].
MatWeb, 2024. Tensile Property Testing of Plastics. Available at: https://www.matweb.com/reference/tensile-test.aspx [Accessed 7 August 2024].
Relationship Between, 2024. Relationship Between Tensile Strength And Elongation. Available at: https://relationshipbetween.com/relationship-between-tensile-strength-and-elongation [Accessed 7 August 2024].
This vs. That, 2024. Tensile Strength vs. Young’s Modulus – What’s the Difference? Available at: https://thisvsthat.io/tensile-strength-vs-youngs-modulus/ [Accessed 7 August 2024].
The content appearing on this webpage is for informational purposes only. KC Seals makes no representation or warranty of any kind, be it expressed or implied, as to the accuracy, completeness, or validity of the information. Any performance parameters, geometric tolerances, specific design features, quality and types of materials, or processes should not be inferred to represent what will be delivered by third-party suppliers or manufacturers through KC Seals’ network. Buyers seeking quotes for parts are responsible for defining the specific requirements for those parts.